The Executive Dashboard will enhance the functionality of SmartPM by providing overall project insights for a company’s entire portfolio of ongoing projects. This is accomplished by aggregating schedule data across a number of mission-critical analytic categories, combining them, and producing a “macro view” - an average of the performance in each category. This comprehensive insight will help executives identify specific areas that regularly prove to be “project killers,” allowing them to create long-term corrective actions and ultimately reduce their collective project risk.
SmartPM’s current dashboard features simple, cumulative project totals, such as Total Projects, Projects Delayed, Projects on Track, and Projects That Need New Schedules. The new dashboard incorporates several parameters that compute averages across all projects, such as Average Project Health Index™, Average Schedule Quality Index™, Average Compression Index™, Average SPI, and Average Finish Variance. The values in these areas represent a health check of an organization’s entire scheduling process, from schedule creation to project completion.
Michael Pink, CEO of SmartPM Technologies, believes that the new dashboard’s broader perspective will help contractors and builders bring significant improvement to their project performance and risk mitigation strategies on a long-term basis.
“Our SmartPM platform has always provided customers with the necessary intelligence to help them improve schedule quality and mitigate risk on individual projects,” he said. “Now, our new Executive Dashboard will help company executives get a better sense of how their projects are performing as a whole while identifying repeated problem areas that can’t always be seen by analyzing projects one at a time.
“In the bigger picture, it will help them craft a strategy on how to improve their business and empower them with clear KPIs to ensure they are moving in the right direction.”
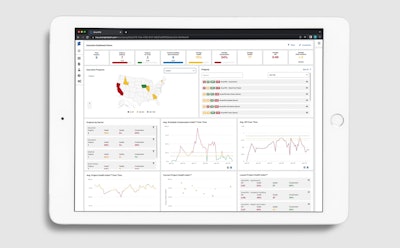
The dashboard not only gives users access to valuable insights, it can also serve them up according to myriad measurables. The Executive Progress map, for example, lets users cluster projects together by region or country, which might reveal weak spots based on geographics. A CEO might see that all the company’s projects are highly compressed in New York only in January and might surmise that it’s due to winter-weather conditions. But if the compression occurs on a more sporadic timetable, the executive can look in different places for the causes.
A project could also be viewed through one of the more common parameters – date. Finding out which months are strongest and in which ones the majority of the obstacles crop up would be highly instructive. There is also a geographical “heat map” that can be used to identify hotspots based on quality, compression, performance, and other criteria.
Metadata fields can be created for almost any grouping – even by specific subcontractor or industry vertical. This provides the user with the ability to view the information in any form they desire, revealing insights that may not be readily obvious using limited fields.
Data in the Executive Dashboard can be restricted based on titles and responsibilities. So while a C-suite executive may be able to view the company’s entire project portfolio, a regional manager could be given access only to the jobs in their region.
Rather than going through the tedious process of looking at each project individually – an arduous task for companies with 100 or more projects under their roof – it’s possible to pull out the top five worst-performing jobs based on compression, schedule quality, overall health, and a number of other parameters. And that list will be automatically revised as new updates are incorporated. Given that most construction professionals have packed schedules with little time to spare, this can help them prioritize where they should direct their attention.
About SmartPM
Founded in 2016, SmartPM™ Technologies Inc. is a leading construction analytics provider headquartered in Atlanta. SmartPM launched its cloud-based software in 2019 and is now the only comprehensive, schedule-centric analytics solution designed specifically for the construction industry by industry experts. SmartPM drives project management by leveraging billions of data points from the construction schedule to automate schedule and project reviews while extracting insights to mitigate risk, control costs, reduce delays, and increase profitability. SmartPM keeps all parties involved in a project in the loop, so each stakeholder clearly understands their own particular risks and financial ramifications. For more information, visit https://smartpmtech.com/.